Grant Gager, City Manager
406-823-6000
04 May COVID-19 Update for Park Co.
Welcome to our informational series on COVID-19 data for Park County and the State of Montana!
There is a lot of data on COVID-19, but we hope to take this week to show you how we try and turn that data into information – something you can use to inform decisions and determine how things are going. The City of Livingston doesn’t produce the data, but we do use data provided by the Health Department, the State, and other sources to create some information that is useful. As with any data set, there are errors, omissions, and other factors that can affect your information, but overall it is a useful tool to see where you are and where you are headed. Before we can look at our first chart we need to establish some vocabulary to make sure we all understand terms to mean the same thing. As we look at different charts over the next few days, the following terms will be used often:
Total Cases – the number of COVID-19 cases identified in a jurisdiction (state or county). This is useful to compare the magnitude of a problem between jurisdictions, but doesn’t help show where you are or where you’re going.
Active Cases – the number of COVID-19 cases (hospitalized or un-hospitalized) where individuals have tested positive for the virus and are fighting the disease. This shows the current scope of the COVID-19 problem. Active cases equal the total cases minus recovered and deaths.
New Cases – the number of new COVID-19 cases identified in a given time period (usually per day). This data is useful in determining where you are headed. The rate of new COVID-19 cases are appearing shows the effectiveness of preventive measures and helps to predict future strain on the health care system.
Recovered – the number of people who have been identified as having COVID-19 who have recovered from the disease and returned to normal life. Recovered versus new cases will show if the COVID-19 problem is growing or shrinking.
Hospitalized – the number of people who are being cared for in a hospital due to COVID-19.
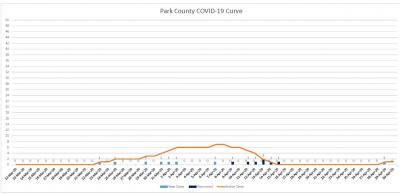
Combining all these data points on one chart and graphing them over time gives a good picture of the overall health of the community in relation to COVID-19. Today’s chart is the COVID-19 historical data for Park County beginning on the 12th of March. This chart is what we can refer to as the COVID-19 “curve” for Park County. When we took steps to “flatten the curve," this is the curve that we were referring to. Overall, it is difficult to ascertain too much from this chart because our overall numbers for COVID-19 were extremely low – which is great! What we can see is that, so far, our cases of COVID-19 began on 23 Mar, peaked on 7-8 Apr at seven (7) cases (active) 15 days later and then quickly decreased to zero (0) by 15 Apr. The last new case in Park County was confirmed on 29 Apr, which was over three (3) weeks from the previously confirmed case on 07 Apr. With one (1) active case in Park County, we have done a remarkable job of controlling the spread of COVID-19. Now, as phased openings have begun, we will continue to watch new cases closely to identify any changes in our trajectory.
One data point not shown on this chart is of hospitalized patients. Over the course of this chart, Park County had one (1) patient hospitalized due to COVID-19 and there are currently no patients hospitalized. This is another example of the effectiveness of the measures taken to date. Livingston Health Care was not overwhelmed by the number of COVID-19 patients needing care and has had excess capacity to care for COVID-19 patients at all times. This chart tells a good news story of appropriate actions taken that have been effective in accomplishing our goals of “flattening the curve” and maintaining healthcare capacity. Now, we continue to monitor our curve and ensure that our phased reopening is a continuation of our good story and not a plot twist towards tragedy.
Tomorrow we will look at the same information for Gallatin County and see how we compare!

