Grant Gager, City Manager
406-823-6000
06 May COVID-19 Update for The State of Montana
It’s Day 3 of our COVID-19 informational series! If you haven’t read the first two days’ posts, I encourage you to go back and review them so today’s information has a broader context.
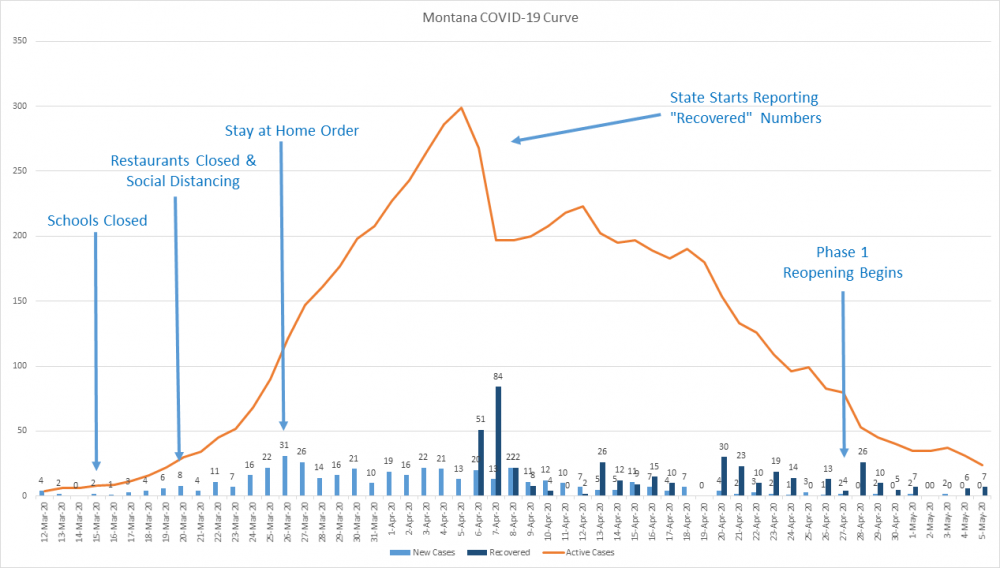
COVID-19 data for Montana suffers from the same defects as the Gallatin County data, but to a lesser degree – recovered case statistics weren’t made available publically until April 6th, 2020. This leads to the onset of the curve looking severe, almost exponential, but when recovered cases are factored in, the growth seems much more controlled. Applying the same method we did for Gallatin County (please remember the disclaimers from yesterday) we can roughly estimate the peak for the State occurred somewhere around April 13th, or about a week after Park County, and almost two (2) weeks after Gallatin County. This seems consistent with the later increase of cases in Yellowstone County that would shift the State peak numbers to a later date than the local peaks. If we estimate the maximum number of simultaneous active cases to be in the range of 220-225 it shows that the State was not in danger of overwhelming the healthcare system. To give a reference for magnitude, the greatest number of concurrent hospitalizations noted was 31; Bozeman Health was prepared to handle 100 inpatients with 17 of them being ICU admissions. In other words, Bozeman Health alone could have handled every COVID-19 patient in the State of Montana using one third (1/3) of their capacity.
Our Montana chart has some additional information that was not included on the County charts – milestones of different orders from the Governor. While they are included to help get a feel for the general timeline, it is wise to use some caution before trying to draw any conclusions about the effects of the different measures. It is easy to look at different points and “see” immediate effects. The “Stay at Home Order” occurs on the same day as the highest single day of new cases in Montana and would seem to show an instant reduction in daily cases. However, because the virus does not immediately manifest symptoms it is likely that there is a lag in seeing effects from any action that could be seven (7) to ten (10) days long. In addition to new cases being a lagging indicator, there could be any number of other occurrences in the time frame that could affect the new case numbers. This applies equally to the Phase 1 lifting of restrictions. If the result is an increase in daily cases, we would expect that increase to be in the future. While it is tempting to draw conclusions from the decisions in the Governor’s orders and the subsequent data, it is probably better to just note them as one more data point in the overall picture.
Like Park County and Gallatin County, the COVID-19 story for Montana is generally positive. We will continue to monitor trends to help keep it that way.
Join us tomorrow for information on how the City is looking to help track whether or not COVID-19 is being brought into our community by our visitors and guests.