Grant Gager, City Manager
406-823-6000
05 May COVID-19 Update for Gallatin Co.
Welcome to Day 2 of our COVID-19 informational series! If you missed Day 1, look for yesterday’s post to read about the COVID-19 situation in Park County and to be introduced to the vocabulary we will be using today to compare Park County to Gallatin County.
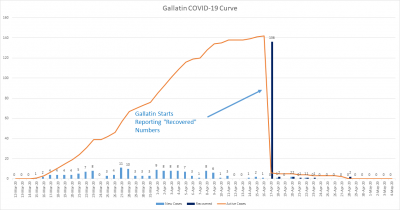
Gallatin County received some notoriety early for being a “hot spot” in the state and for having the greatest number of total cases at 146. However, this graph provides a stark example of why “active” cases are a better indicator of the situation than “total cases”. From the start of the situation until the middle of April, Gallatin County only provided new cases and total cases on its website. While they may have been tracking recoveries locally, they were not providing that information publicly until 17 April. That lack of early information on recovered cases created a graph that looks like it is climbing rapidly, however, when recovered cases were added to the picture on 17 April the graph crashes back down to what seems to be a much safer territory. While a great illustration of the difference between data and information, it makes understanding the spread of COVIDE-19 in Gallatin County more difficult.
**Warning – The Following is Complete and Utter Speculation**
To help in visualizing the spread of COVID-19 in Gallatin County vs. Park County it is necessary to estimate the shape of the curve if recovered patients had been reported from the beginning. Assuming a fairly normal distribution, or bell curve, it is possible to overlay a rough estimate of what Gallatin’s curve looked like. While almost assuredly not accurate, this estimated curve would likely peak around 1-2 April with a max number of active cases somewhere in the range of 60-65. Feel free to try to estimate yourself and see if you come up with a different looking curve.
**End of Speculation**
Why bother to estimate a curve when it is impossible to know if it’s correct? Well, it gives us a basis, even if speculative, to compare Gallatin to Park County. We know that Gallatin saw their first case of COVID-19 just over a week before Park County. Our estimated peak for Gallatin County occurred just under one week prior to Park County. That seems fairly consistent and lends a little credibility to our estimate. The important point is that even with 146 total cases and a peak of 65 active cases, Gallatin has only seen a total of 5 hospitalizations. Unfortunately, Gallatin County also has experienced one (1) death associated with COVID-19. Despite that loss, Gallatin has maintained healthcare capacity well beyond its COVID-19 requirements and could have accepted patients from Park County if necessary. Like Park County, Gallatin County’s story is good news. Despite having the largest number of COVID-19 cases and almost assuredly the greatest number of simultaneous active cases, Gallatin’s healthcare system was not overwhelmed and they currently have zero (0) active cases in the county.
Tomorrow we will look at the same information at the state level and see how the COVID-19 curve looks for Montana.

